When working with vectors consisting of real numbers in two or three dimensions, it is very useful to visualize the vectors using directed line segments. A directed line segment is a straight line drawn between two points, with one end marked by an arrow to indicate the direction of the vector. This type of representation helps in understanding concepts such as the length (magnitude) of a vector, the angle between two vectors, and orthogonality (perpendicularity).
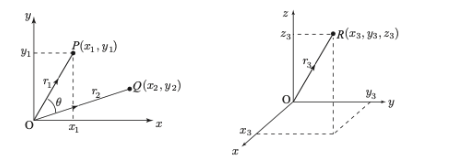
Let’s first consider the Cartesian coordinate system in the xy-plane and a point P in this system. We can draw a directed line segment from the origin (0, 0) to point P. This line segment is considered the position vector of point P, and it is denoted as 𝒓₁.
This vector can be written as:
𝒓₁ = 𝑂𝑃 = (𝑥₁, 𝑦₁)
Here, 𝑥₁ and 𝑦₁ are the components of the vector 𝒓₁ in the given xy-coordinate system. Similarly, the position vector of point Q can also be calculated in the same way.
In three-dimensional space, if a point R has coordinates (𝑥₃, 𝑦₃, 𝑧₃), its position vector is expressed as:
𝒓₃ = (𝑥₃, 𝑦₃, 𝑧₃)
An important point to note here is that the components of a vector can change when a different coordinate system is used. That is, the components of the vector may take different values depending on the coordinate system in use.
Graphical representations are particularly helpful for calculating the length or magnitude of vectors. The magnitude can be calculated mathematically using the Pythagorean theorem.
If r is a vector, its magnitude is calculated as follows:
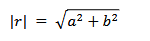
This formula is used to calculate the length of a two-dimensional vector. For a three-dimensional vector, the same calculation is done by adding the z component as well.